GridSmart
Traffic Management
Competencies
Experience Audit
User Research
Stakeholder Interviews
Interaction Design
Interface Design
Information Architecture
Design Library
Partnership Context
How user-focused design helped a traffic technology company reimagine intersection management
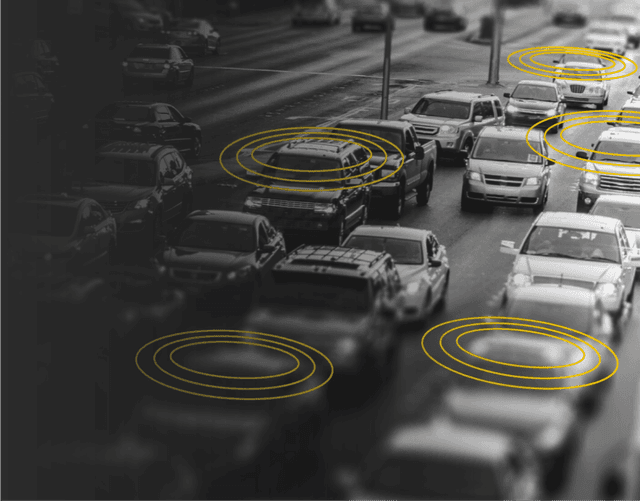
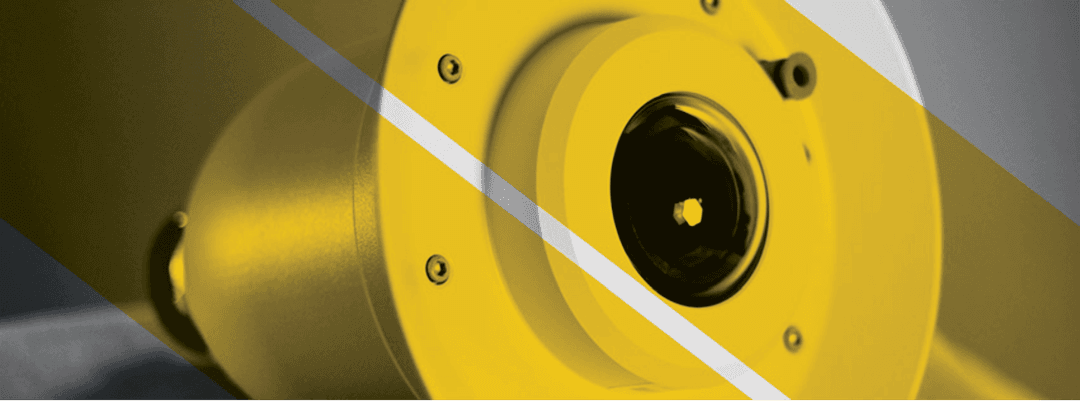
GridSmart aimed to improve intersection management for safety and traffic flow. They created a product using a fisheye camera for real-time monitoring, needing a user-friendly interface for engineers.
GridSmart faced challenges moving to market, needing a new user experience for engineers.
Complexity of Traffic Data
Engineers needed an interface that could handle the intricacies of live traffic management, phase settings, and adaptable configurations across different municipalities and state standards.
Real-Time Video Interaction
Utilizing live, 360° video feed presented a novel UI/UX challenge—engineers had to be able to set and adjust signals accurately without losing context of the traffic situation.
Industry First Technology
To support widespread adoption, Gridsmart’s interface had to be intuitive and relatable, even for engineers unfamiliar with digital traffic management.
Flying Circle partnered closely with GridSmart, embedding our design team on-site with their developers from concept through market entry. We collaborated to deliver a series of UX innovations that redefined intersection management:
Our collaboration resulted in a product that set a new standard in intersection management. Today, GridSmart’s solution is deployed in thousands of intersections globally and is recognized for its intuitive design, operational impact, and role in advancing urban safety and traffic flow.
Project Research
Understanding traffic management
Working on site with civil engineers. Attending department of transportation seminars
Loop Detection
Project research the management team provided materials to bring Flying Circle’s team up to speed on traffic and red-light management. The loops in the group create an electric signal when you stop at a red light. The signal is then sent to the control box to alert to your presence at the intersection. Core functionality that would be critical for users to understand in the initial product.
Lane Phasing
The second factor to a successful traffic light is the alignment of lanes. The relationship from lane to lane is the basis for how engineers establish rules for an intersection; a factor Flying Circle later highlighted in the user interface.
Competitor Analysis
Understanding the needs of Civil/Traffic Engineers included deep analysis of current industry leaders. Task completion steps were identified and documented for discussion with the development team. Later, these tasks would be broken down and reassembled to create entirely new ways of managing traffic.
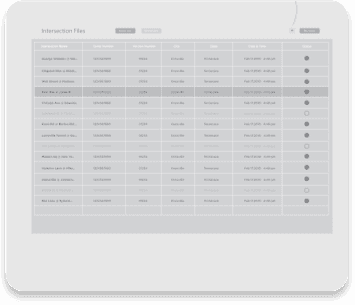
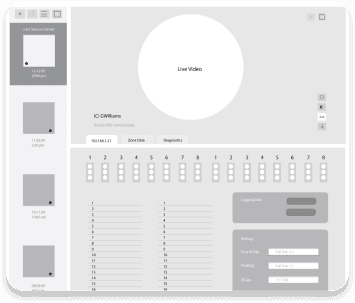
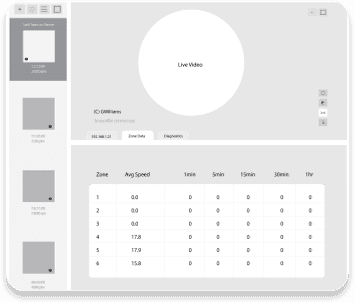
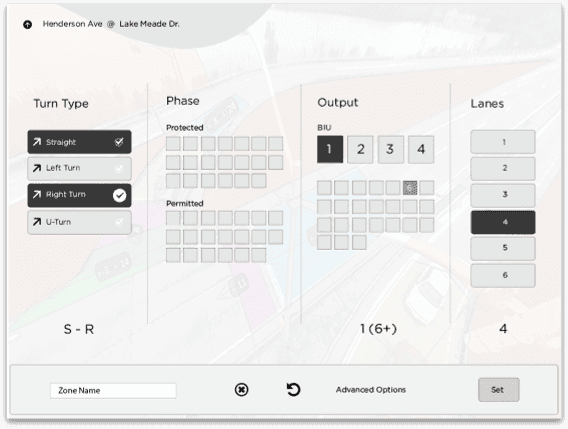
Option 1: Video as Reference
The UX research findings and technical factors were combined with new user workflow concepts to create many rounds of wireframes. Hundreds of wireframes later a distinction emerged between wrapping the video with inputs and controls or rendering them separately.

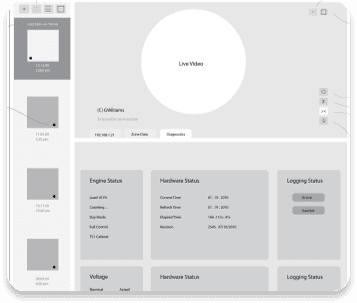
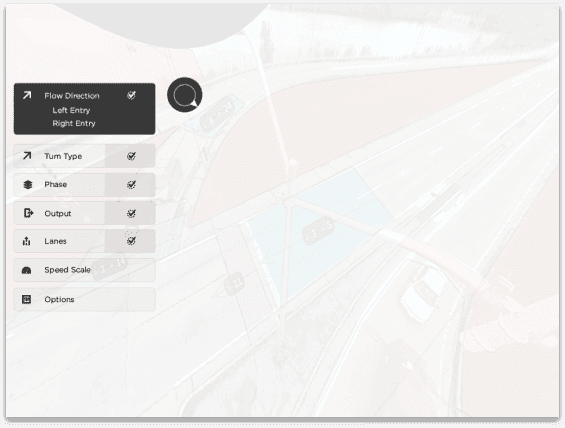
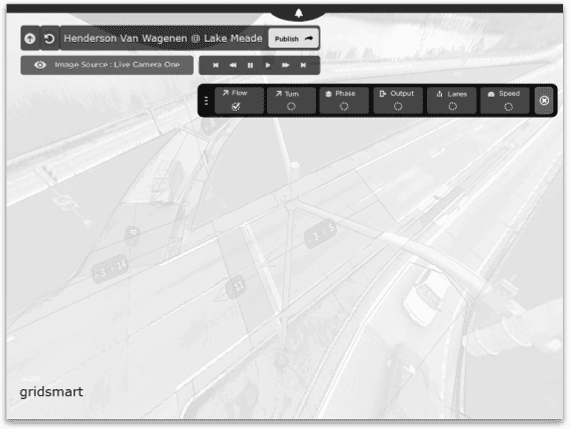
Option 2: Video as Canvas
In this direction, the video itself became the canvas. Inputs and controls were rendered as overlays directly on the live feed, letting engineers configure zones without losing situational context.
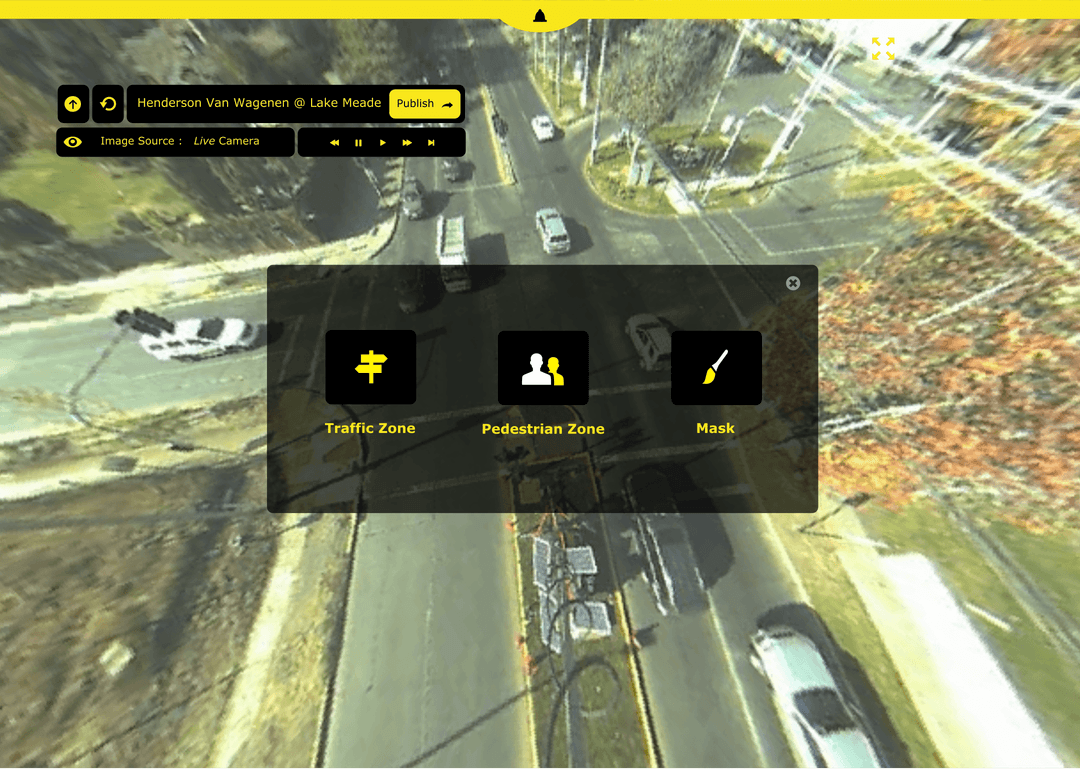
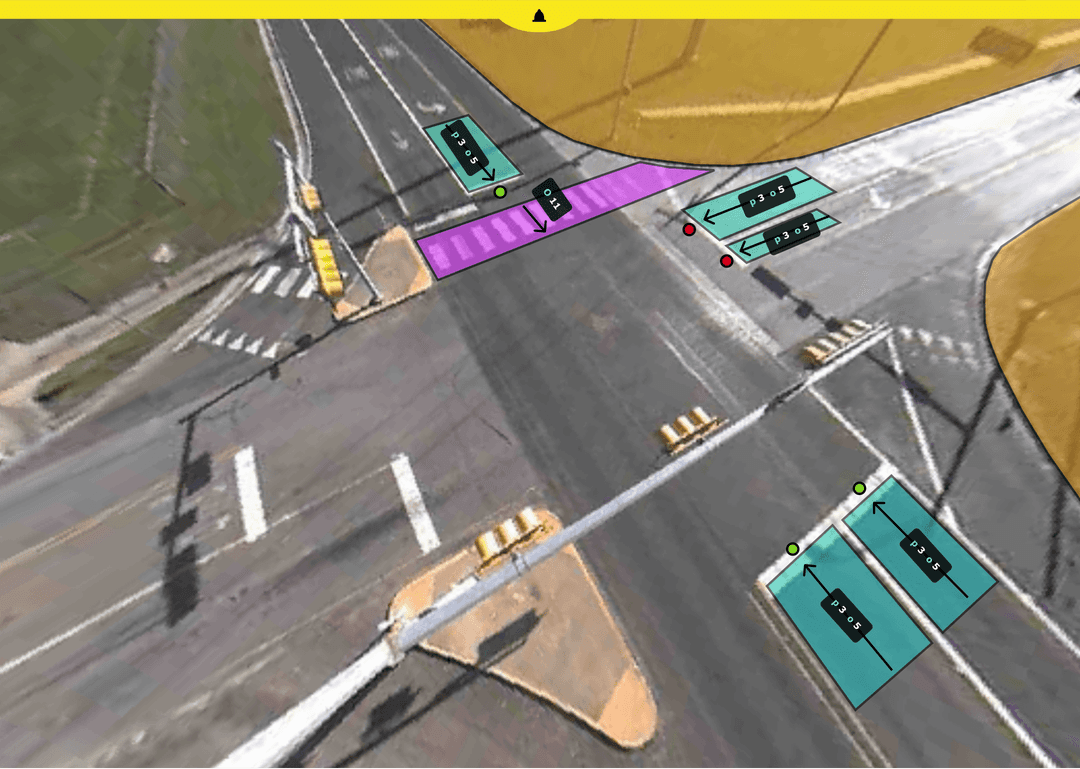
We pioneered a new interaction model that allowed engineers to “draw” on the live video feed, defining zones and signal phases directly on the intersection view. By de-warping the 360° image and adding high-contrast overlays, we ensured that engineers could maintain situational awareness while managing settings—a shift that redefined the industry’s approach to traffic control.
Drawing ‘zones’ on top of video would become the foundation for GridSmart 1.0.
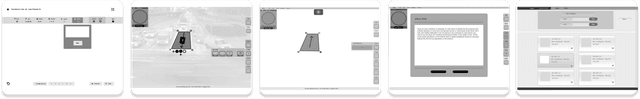
Wireframe Iteration
Once the canvas approach was established, the team iterated on layout: how to balance the live feed with controls, when to expose secondary settings, and how engineers would move between configuration and monitoring modes.


Usability
User Testing with Engineers
Different methods and workflows were tested for clarity, readability, and time to event. These results were applied to the next round of wireframes where each input was optimized for the best result.

Hardware branding conveyed via software
GridSmart’s one-camera advantage is commonly
located in the center of the intersection
located in the center of the intersection

The GridSmart software user-interface is uniquely
centered to mimic the hardware aspects of the brand
centered to mimic the hardware aspects of the brand

‘The iPhone of Traffic Management’
GRIDSMART 1.0


See the success of the Flying Circle approach
See the success of the Flying Circle approach